Demonstration Test: Internet Risk Visualization Service -Mejiro-


Asia
Europe
Africa
Oceania
Americas
Other
Mejiro Explained
Introduction
On the Internet, there are various risk factors that can make web service down. Mejiro collects data on these risk factors from data providers, uses the data to calculate indexes by region, and visualizes risks based on the index values. To obtain a more accurate picture of the situation, Mejiro creates objective risk indexes that can be compared and analyzes the information from various angles. See below for details on how to obtain data and calculate indexes. Mejiro uses what we call "Mejiro indexes" in its analysis. Mejiro indexes are obtained by plotting the number of risk factors identified in a region and the number of IP addresses assigned in that region ("number of IP addresses") on a double-logarithmic graph, and calculating the standard score of distance from the regression line. (Numbers of IP addresses vary greatly depending on the region and range from several hundred to over a billion. Since it can be assumed that the number of risk factors will increase in proportion to the number of IP addresses, numbers of risk factors are also likely to vary over a wide range spanning numerous digits. To enable discussions on an equal basis without regard to the difference in data size, we take the logarithm of both numbers and draw a comparison based on "the numbers of digits.") These indexes provide an idea about how the numbers of risk factors in the region compared global standards, and how differences from the standards compared risk factors. The indexes will serve as a reference in comparing the severity of risk factors across countries and regions and determining the order of priority for implementing countermeasures. We also hope that this service will lead to the mutual sharing of knowledge about how to implement countermeasures and relevant experiences. Mejiro builds on the basic principles of the Cyber Green Project, which JPCERT/CC has been working on since FY2014, and it visualizes Internet risks based on our unique approach.Target Risk Factors
From out of the various risk factors that exist on the Internet, Mejiro specifically targets "open UDP servers" in this demonstration test. (Here, an "open UDP server" refers to a server that returns some kind of a response to a request message sent using a UDP protocol, where the size of the response is larger than that of the request.)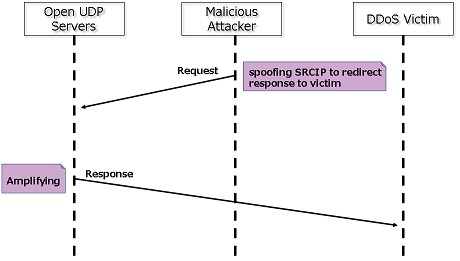 Open UDP servers are exploited to perform reflection DDoS attacks, and the entire information security community including JPCERT/CC is working to reduce the number of these servers.
Mejiro measures and analyzes the following six types of open UDP servers, mainly those that exist in large numbers.
* DNS (Open Resolver)
* NTP
* RPC
* SIP
* SNMP
* SSDP
In addition to risk factors that can be exploited to carry out a DDoS attack, Mejiro also targeted microsoft-ds (445/tcp) as a risk factor that can potentially be exploited in other attacks such as WannaCry.
We plan to increase the number of target risk factors measured and analyzed using Mejiro.
Open UDP servers are exploited to perform reflection DDoS attacks, and the entire information security community including JPCERT/CC is working to reduce the number of these servers.
Mejiro measures and analyzes the following six types of open UDP servers, mainly those that exist in large numbers.
* DNS (Open Resolver)
* NTP
* RPC
* SIP
* SNMP
* SSDP
In addition to risk factors that can be exploited to carry out a DDoS attack, Mejiro also targeted microsoft-ds (445/tcp) as a risk factor that can potentially be exploited in other attacks such as WannaCry.
We plan to increase the number of target risk factors measured and analyzed using Mejiro.
Data Source
Mejiro obtains data from data providers.- Risk factor data
- SHODAN Mejiro uses a service provided by SHODAN [1]to get the numbers of UDP servers and microsoft-ds (445/tcp) that can be accessed on the Internet. Example of open resolver counts obtained by region:
$ shodan stats --facets country:500 "recursion: enabled before:DD/MM/YYYY""recursion: enabled" is a key used to search for open resolvers, and "--facets country:500" specifies that counts be returned[2] by region. "before:DD/MM/YYYY" specifies the date of search and that counts be returned for before that date. This ensures that a slight variance in the search time will not affect the counts. [3] [1]:SHODAN ® (https:/www.shodan.io) [2]:The country and region identifiers used by SHODAN are ccTLDs, and to ensure counts are returned for all ccTLDs, 500 lines are specified. Similarly, --facets asn: specifies that counts be returned by ASN. [3]:In SHODAN's database, numbers of risk factors vary considerably depending on the timing when the day's data are obtained. Mejiro investigates the numbers of risk factors that were found in the past 30 days or so to minimize the variation. The table below shows the search keys used to get data from SHODAN, including open resolvers.
| Protocol | Risk | SHODAN search key |
|---|---|---|
| DNS | Open Resolver | recursion: enabled |
| NTP | Open NTP Server | NTP stratum: |
| RPC | Open RPC Server | port:111 portmap |
| SIP | Open SIP Server | SIP/ /UDP |
| SNMP | Open SNMP Server | port:161 |
| SSDP | Open SSDP Server | upnp location: |
| microsoft-ds | Open microsoft-ds Server | port:445 |
SELECT
 count(1),
 location.country_code
FROM
 `censys-io.ipv4_public.YYYYMMDD`
WHERE
 p53.dns.LOOKUP.open_resolver
Group By
 location.country_code
This selects open resolver counts by country and region.
[4] censys:Copyright 2017 Regents of the University of Michigan
- Number of IP addresses assigned to a region
- MaxMind The number of IP addresses assigned to each region is calculated using the correspondence between the IP address range (CIDR block) and ccTLDs contained in the "GeoLite2 Country" data of MaxMind.
Visualization of Risks
(1) Time series graph (changes in the number of nodes in a period)
 A time series graph shows the numbers of each risk factor obtained from data by country and region in chronological order.
This graph gives a high-level overview of changes in the number of risk factors in each region along the time axis.
However, the number of risk factors indicated here is assumed to be proportionately large in countries and regions with a large number of IP addresses, and relatively small in those with a small number of IP addresses,
so it would not be valid to simply compare absolute numbers. As such, we will make relative comparisons using (2) scatter plots.
With Mejiro, too, there are cases in which the number of risk factors in a region varies relatively considerably with the passage of time, and in such observations,
it seems that the count tends to vary considerably depending on the time, place, and method of observation. We assume that the variation might be caused by the following differences.
A time series graph shows the numbers of each risk factor obtained from data by country and region in chronological order.
This graph gives a high-level overview of changes in the number of risk factors in each region along the time axis.
However, the number of risk factors indicated here is assumed to be proportionately large in countries and regions with a large number of IP addresses, and relatively small in those with a small number of IP addresses,
so it would not be valid to simply compare absolute numbers. As such, we will make relative comparisons using (2) scatter plots.
With Mejiro, too, there are cases in which the number of risk factors in a region varies relatively considerably with the passage of time, and in such observations,
it seems that the count tends to vary considerably depending on the time, place, and method of observation. We assume that the variation might be caused by the following differences.
- Difference in the IP addresses of the scanned nodes
- Difference in the requests sent when performing scans
- Difference in the timing and frequency of scans
- Difference in the thresholds and interpretation when selecting responses
- Difference in the ACL of the scanned nodes
- Difference due to changes over time in the reachability of packets
(2) Scatter plots (numbers of risk factors and IP addresses)
 Mejiro makes relative normalization based on the number of IP addresses. However, the numbers of IP addresses vary greatly depending on the region and range from several hundred to over a billion.
As such, it can be assumed that the numbers of risk factors will also vary accordingly, at least by several digits.
Generally, when dealing with numbers that differ by multiple digits in an analysis, the numbers are analyzed in terms of their common logarithms.
Mejiro likewise performs analysis using the common logarithms of the numbers of IP addresses and risk factors.
We found out that when these two parameters are represented on a double-logarithmic plot , a regression line with relatively small residuals can be drawn.
On this scatter plot, the common logarithms of the numbers of IP addresses are plotted along the x-axis, and those of the numbers of risk factors identified in each country and region along the y-axis.
Since the diagram plots common logarithms, broadly speaking we are looking at “the number of digits” of each count.
Although there are certain variances within the scatter plot, you can see that the data points of each country and region are mostly distributed from the lower left (i.e., small numbers of IP addresses and risk factors) to the upper right (i.e., large numbers of IP addresses and risk factors),
and that there are few or no data points in the upper left and lower right areas of the diagram.
We discovered that a regression line with relatively small residuals can be drawn if orthogonal distance regression (ODR) is applied to this type of distribution.
(The equation of the regression line is shown in the scatter plot as well.)
This regression line in a way represents the "average numbers of risk factors expected in a region of a certain size."
Therefore, the (orthogonal) distance from the regression line can be interpreted as indicating "how much a certain data point is higher or lower than the number of risk factors that are expected to exist in a region, based on its size."
In other words, if a data point deviates from the regression line in the direction of fewer risk factors, it can be assumed that the region has "fewer risk factors than the global average" ("more" if the data point deviates in the opposite direction),
and the degree of deviation indicates "how much the number is higher or lower."
Mejiro calculates the standard score of distance from the regression line and uses it as an index.
Mejiro makes relative normalization based on the number of IP addresses. However, the numbers of IP addresses vary greatly depending on the region and range from several hundred to over a billion.
As such, it can be assumed that the numbers of risk factors will also vary accordingly, at least by several digits.
Generally, when dealing with numbers that differ by multiple digits in an analysis, the numbers are analyzed in terms of their common logarithms.
Mejiro likewise performs analysis using the common logarithms of the numbers of IP addresses and risk factors.
We found out that when these two parameters are represented on a double-logarithmic plot , a regression line with relatively small residuals can be drawn.
On this scatter plot, the common logarithms of the numbers of IP addresses are plotted along the x-axis, and those of the numbers of risk factors identified in each country and region along the y-axis.
Since the diagram plots common logarithms, broadly speaking we are looking at “the number of digits” of each count.
Although there are certain variances within the scatter plot, you can see that the data points of each country and region are mostly distributed from the lower left (i.e., small numbers of IP addresses and risk factors) to the upper right (i.e., large numbers of IP addresses and risk factors),
and that there are few or no data points in the upper left and lower right areas of the diagram.
We discovered that a regression line with relatively small residuals can be drawn if orthogonal distance regression (ODR) is applied to this type of distribution.
(The equation of the regression line is shown in the scatter plot as well.)
This regression line in a way represents the "average numbers of risk factors expected in a region of a certain size."
Therefore, the (orthogonal) distance from the regression line can be interpreted as indicating "how much a certain data point is higher or lower than the number of risk factors that are expected to exist in a region, based on its size."
In other words, if a data point deviates from the regression line in the direction of fewer risk factors, it can be assumed that the region has "fewer risk factors than the global average" ("more" if the data point deviates in the opposite direction),
and the degree of deviation indicates "how much the number is higher or lower."
Mejiro calculates the standard score of distance from the regression line and uses it as an index.
Calculation of index
Calculation method to derive an index:(3) Histogram (examining the distribution of index values)
 Histograms give you an idea about the relative overall position of an index for region.
If it is positioned at the center peak of a normal distribution curve, it means that the number of risk factors is about average, and the farther it is toward the right,
the greater the number of risk factors compared to the global average when the number of IP addresses assigned is taken into account.
Since we are able to apply orthogonal regression when calculating Mejiro indexes, we believe the indexes, which are the standard scores of distance from the regression line,
will be distributed in a pattern close to the normal distribution [5]. We can see that the pattern actually follows the normal distribution [6] on a histogram,
but some differences in the pattern may be occasionally observed. Going forward, we will also investigate what this kind of divergence signifies.
[5]: The regression line indicates the average relationship between the number of IP addresses and the number of risk factors,
so any divergence from that line can be interpreted as a divergence from the "average," which means that the distribution should generally follow a pattern similar to the standard deviation in the absence of any deviating factors.
[6]: A KS test has indicated that the pattern follows a normal distribution.
Histograms give you an idea about the relative overall position of an index for region.
If it is positioned at the center peak of a normal distribution curve, it means that the number of risk factors is about average, and the farther it is toward the right,
the greater the number of risk factors compared to the global average when the number of IP addresses assigned is taken into account.
Since we are able to apply orthogonal regression when calculating Mejiro indexes, we believe the indexes, which are the standard scores of distance from the regression line,
will be distributed in a pattern close to the normal distribution [5]. We can see that the pattern actually follows the normal distribution [6] on a histogram,
but some differences in the pattern may be occasionally observed. Going forward, we will also investigate what this kind of divergence signifies.
[5]: The regression line indicates the average relationship between the number of IP addresses and the number of risk factors,
so any divergence from that line can be interpreted as a divergence from the "average," which means that the distribution should generally follow a pattern similar to the standard deviation in the absence of any deviating factors.
[6]: A KS test has indicated that the pattern follows a normal distribution.
(4) Radar chart (comparing indexes)
 Radar charts enable comparison of risk factors that exist in a region and identification of the position of each risk factor relative to the standard
(after making a relative comparison with the number of IP addresses assigned).
We hope that these charts will serve as reference information in determining the order of priority of countermeasures for a given region.
For example, we envision discussions such as if the index value of open resolvers is the biggest, perhaps efforts should be made to improve it.
We can also make cross comparisons by looking at Mejiro indexes of different countries and regions.
For example, if the open NTP server index value of country B is larger than that of country A, then country A could refer to country B's measures to reduce open NTP server as a best practice.
It might be possible to perform this kind of benchmarking. JPCERT/CC is working to mitigate any problems or issues discovered using Mejiro indexes by alerting the appropriate CSIRT,
providing information about best practices, and other means.
We alerted and advised national CSIRTs that showed considerably high index regarding open SIP server.
Radar charts enable comparison of risk factors that exist in a region and identification of the position of each risk factor relative to the standard
(after making a relative comparison with the number of IP addresses assigned).
We hope that these charts will serve as reference information in determining the order of priority of countermeasures for a given region.
For example, we envision discussions such as if the index value of open resolvers is the biggest, perhaps efforts should be made to improve it.
We can also make cross comparisons by looking at Mejiro indexes of different countries and regions.
For example, if the open NTP server index value of country B is larger than that of country A, then country A could refer to country B's measures to reduce open NTP server as a best practice.
It might be possible to perform this kind of benchmarking. JPCERT/CC is working to mitigate any problems or issues discovered using Mejiro indexes by alerting the appropriate CSIRT,
providing information about best practices, and other means.
We alerted and advised national CSIRTs that showed considerably high index regarding open SIP server.
(5) World map bubble(index values on a world map)
 World map bubbles provide a general idea about in which region a certain risk factor exists in large or small numbers by showing Mejiro index values as bubbles with different diameters.
Note, however, that since these values have already been relatively compared with the numbers of IP addresses assigned, they do not indicate "absolute numbers."
World map bubbles provide a general idea about in which region a certain risk factor exists in large or small numbers by showing Mejiro index values as bubbles with different diameters.
Note, however, that since these values have already been relatively compared with the numbers of IP addresses assigned, they do not indicate "absolute numbers."
In Closing
Mejiro is now operating for verification purposes and therefore has much room for improvement. We will continue to work on development to make it a system that can obtain a better picture from better and large observation data, and to improve the calculation method of indexes. We will also tackle new issues identified through Mejiro. We welcome any feedback, thoughts, or questions regarding Mejiro. Cyber Metrics Line, Global Coordination Division Email: mejiro-info@jpcert.or.jpHow to use the time series graph
This graph shows changes in the numbers of nodes that can become risks in a certain time frame. Use it to get an idea of the numbers of nodes.
- Main screen
- Selecting countries and regions
- Enlarging the graph
- Print, image download selection box
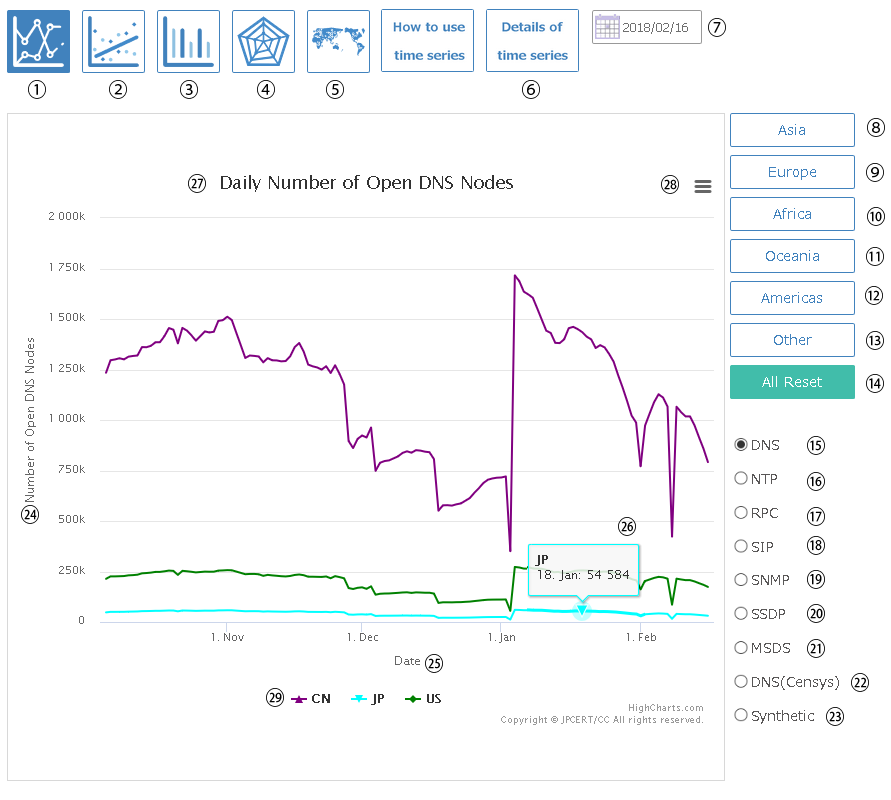
| 1.View time series graph | 16.View time series data of OpenNTP (*1) |
| 2. View scatter plot | 17. View time series data of OpenRPC (*3) |
| 3. View histogram | 18. View time series data of OpenSIP (*3) |
| 4. View radar chart | 19. View time series data of OpenSNMP (*3) |
| 5. View bubble map | 20. View time series data of OpenSSDP (*3) |
| 6. View details about the time series graph | 21. View time series data of devices with open port 445 (*3) |
| 7. Change calculation date (*1) | 22. View time series data of OpenDNS (from Censys data) |
| 8. Select a country/region in Asia (*2) | 23. View time series data of total number of nodes (*3) with risks shown in 15-22 |
| 9. Select a country/region in Europe (*2) | 24. y-axis: number of nodes with risks |
| 10. Select a country/region in Africa (*2) | 25. x-axis: date (day.month) |
| 11. Select a country/region in Oceania (*2) | 26. View ccTLD, date, and number of nodes by moving cursor over graph |
| 12. Select a country/region in the Americas (*2) | 27. Graph title changes with each risk |
| 13. Select other regions (*2) | 28. View print, image download selection box |
| 14. Deselect all | 29. Legend |
| 15. View time series data of OpenDNS (*3) |
*1: The graph shows the data for two years. Data have been obtained starting in October 5, 2017. This function can be used from October 6, 2019 to see past data. *2: Up to five countries and regions can be selected at a time. *3: Data obtained from SHODAN are used.
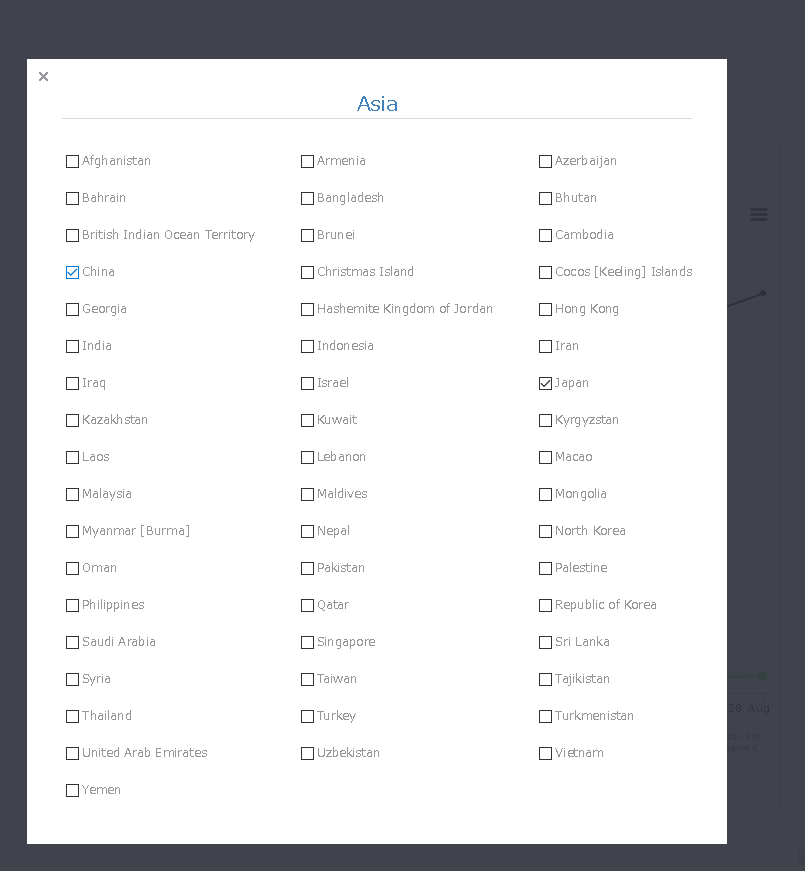
You may choose any five countries and regions. Once selected, click the × mark at the top left or anywhere in the gray area outside the pop-up screen to return to the main screen.
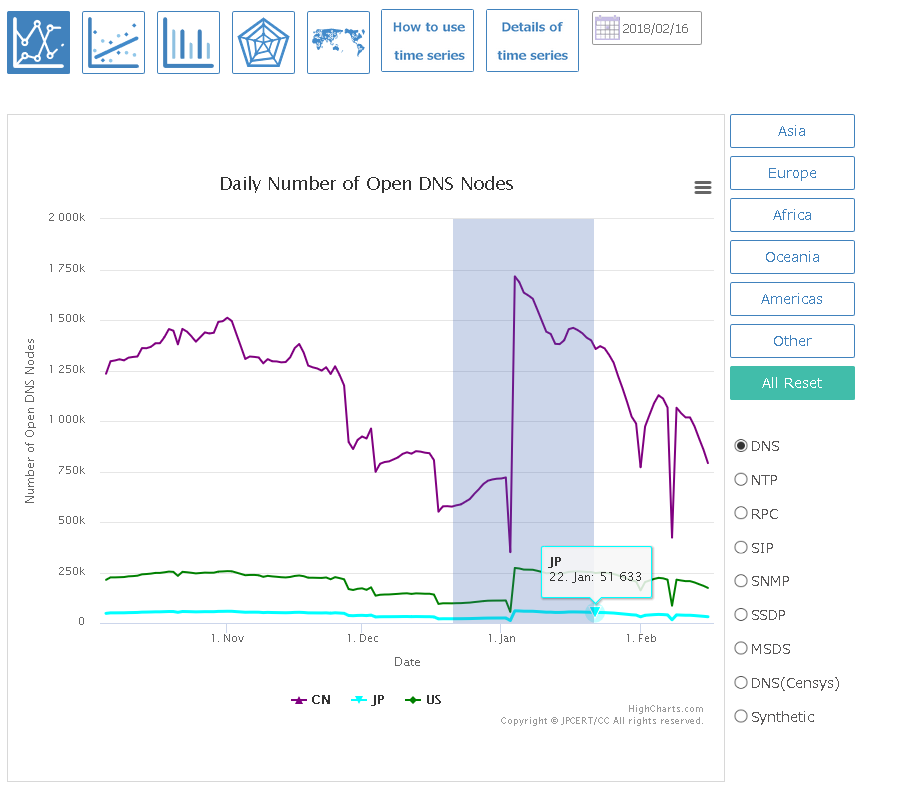
Left-click on the graph and move the cursor sideways to enlarge the graph along the x-axis.
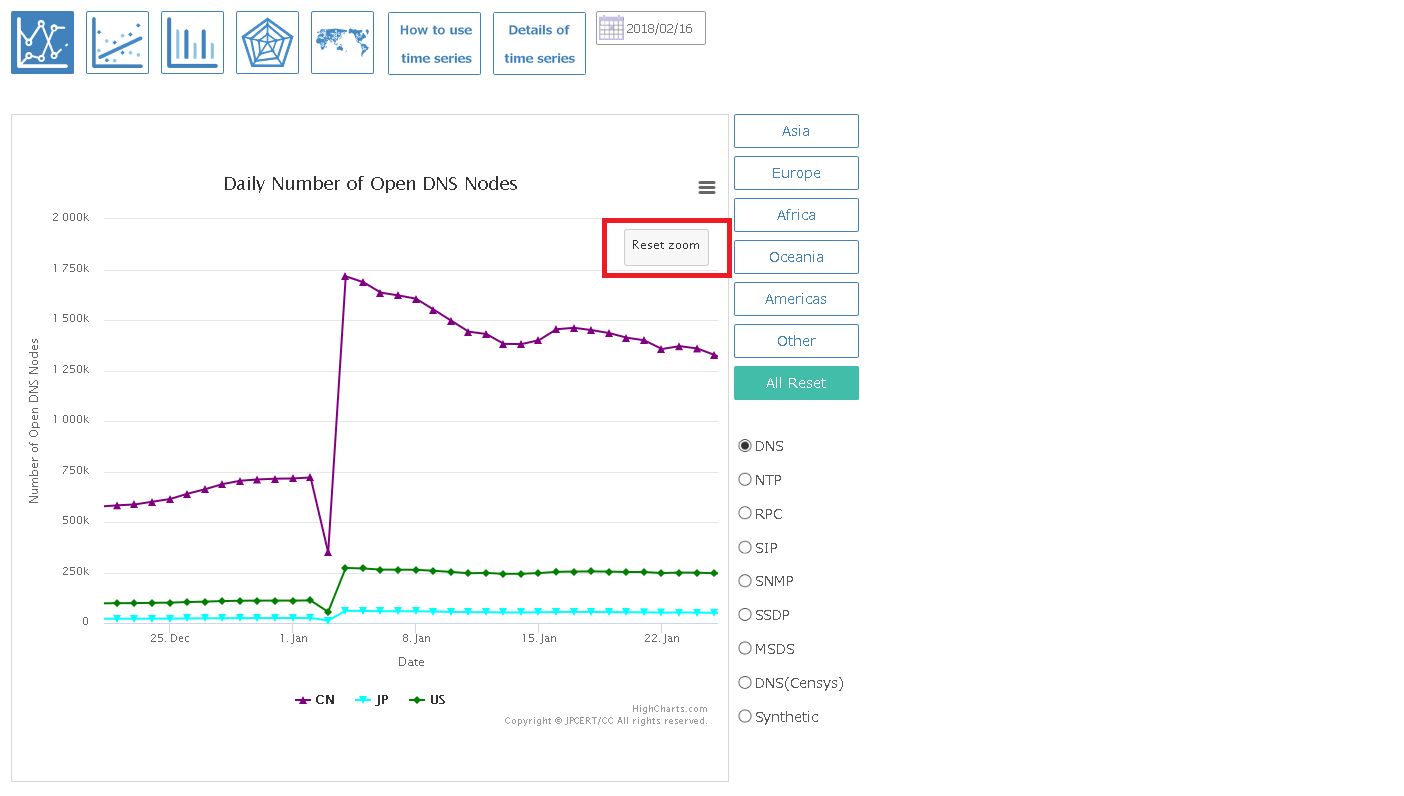
Press the "Reset zoom" button to return to the original magnification.
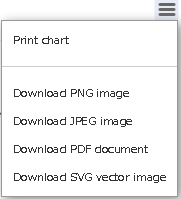
Use this to display the print screen or download PNG, JPEG, PDF, or SVG files.
How to use the scatter plot
This graph shows the density and variance for each ccTLD and risk. Use it to check how far the number of IP addresses assigned and the number of risk nodes are off the average for each ccTLD.
- Main screen
- Selecting countries and regions
- Enlarging the graph
- Print, image download selection box
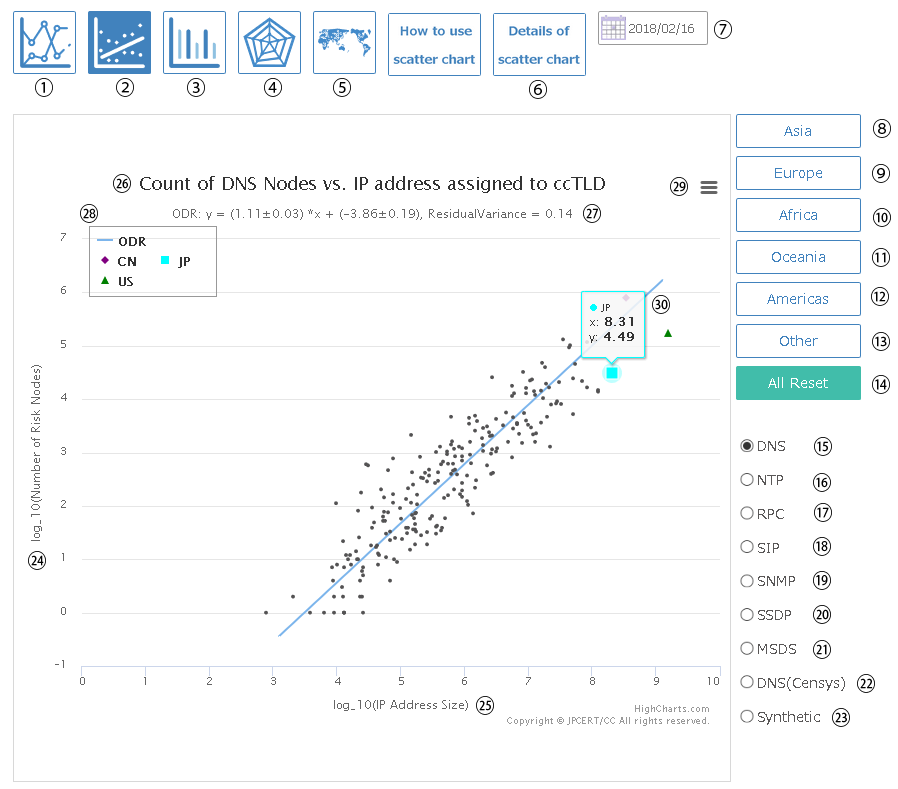
| 1. View time series graph | 16. View scatter plot of OpenNTP (*2) |
| 2. View scatter plot | 17. View scatter plot of OpenRPC (*2) |
| 3. View histogram | 18. View scatter plot of OpenSIP (*2) |
| 4. View radar chart | 19. View scatter plot of OpenSNMP (*2) |
| 5. View bubble map | 20. View scatter plot of OpenSSDP (*2) |
| 6. View details about the scatter plot | 21. View scatter plot of devices with open port 445 (*2) |
| 7. Change calculation date | 22. View scatter plot of OpenDNS (from Censys data) |
| 8. Select a country/region in Asia (*1) | 23. View scatter plot of total number of nodes (*3) with risks shown in 15-22 |
| 9. Select a country/region in Europe (*1) | 24. y-axis: common logarithm of number of nodes with risks |
| 10. Select a country/region in Africa (*1) | 25. x-axis: common logarithm of IP address size |
| 11. Select a country/region in Oceania (*1) | 26. Graph title changes with each risk |
| 12. Select a country/region in the Americas (*1) | 27. Regression line formula for each risk |
| 13. Select other regions (*1) | 28. List of ccTLDs |
| 14. Deselect all | 29. View print, image download selection box |
| 15. View scatter plot of OpenDNS (*2) | 30. View ccTLD, x-axis value, and y-axis value by moving the mouse cursor over a pointer |
*1: Up to five countries and regions can be selected at a time. *2: Data obtained from SHODAN are used.
You may choose any five countries and regions. Once selected, click the × mark at the top left or anywhere in the gray area outside the pop-up screen to return to the main screen. Selected countries are shown in colors and other countries are shown as black dots.
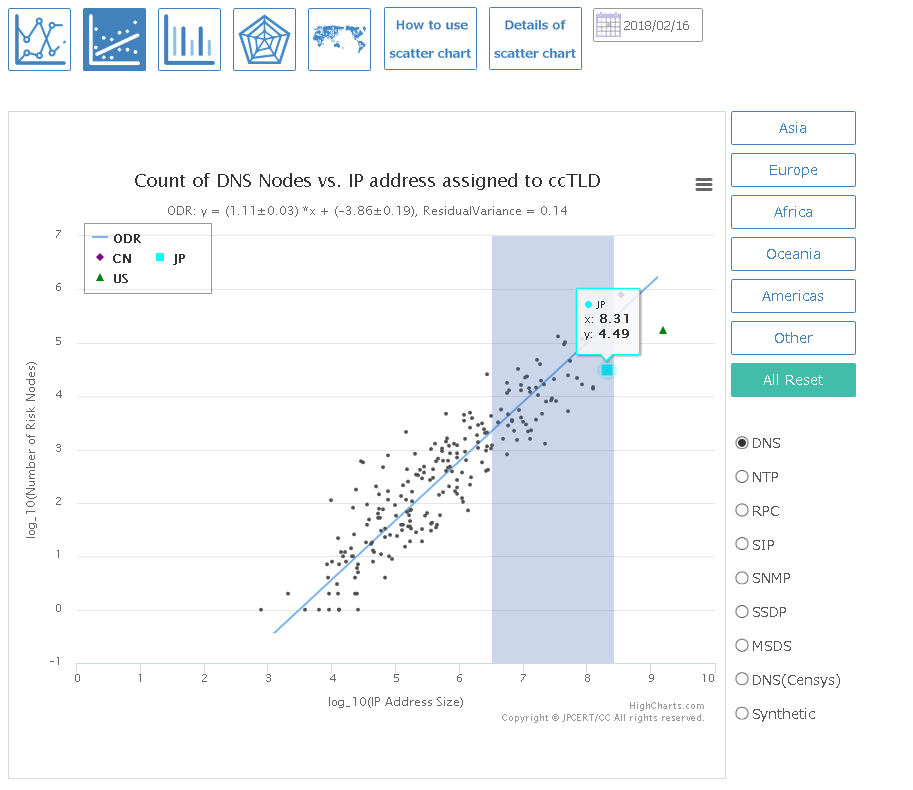
Left-click on the graph and move the cursor sideways to enlarge the graph along the x-axis.
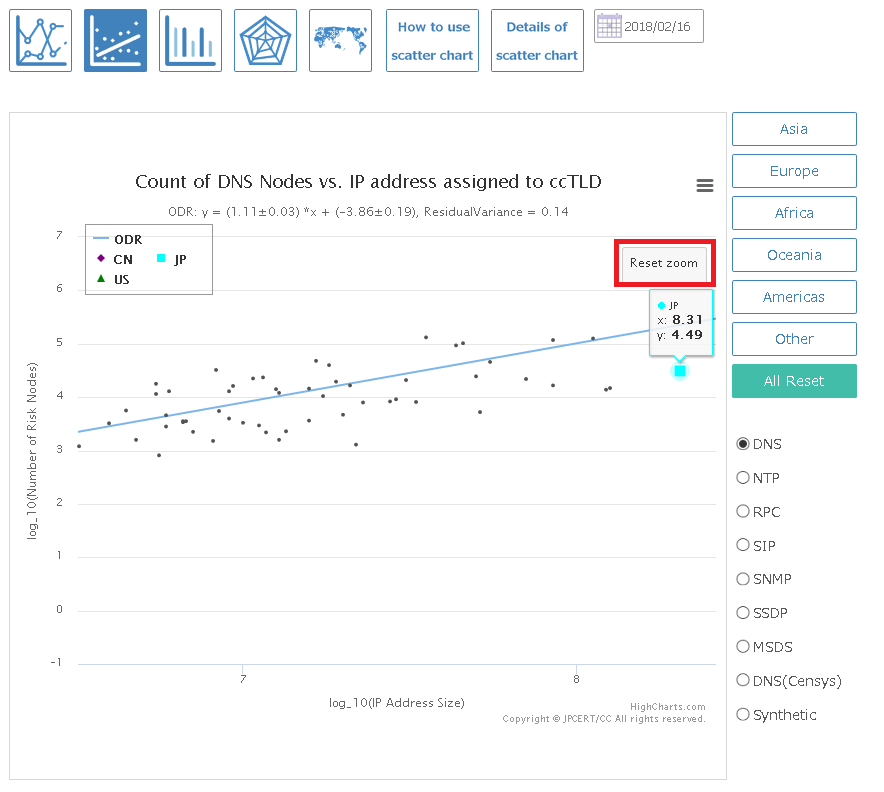
Press the "Reset zoom" button to return to the original magnification.
Use this to display the print screen or download PNG, JPEG, PDF, or SVG files.
How to use the histogram
Index scores are visualized on the histogram. Use it to identify which class a ccTLD belongs to for each risk.
- Main screen
- Print, image download selection box
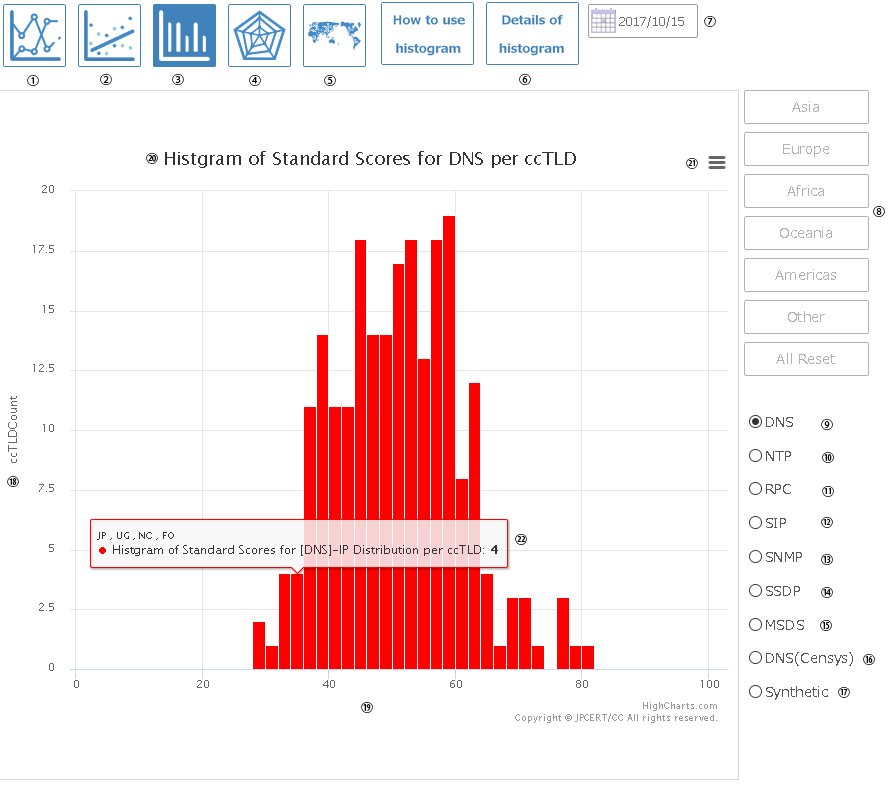
| 1. View time series graph | 12. View histogram of OpenSIP (*1) |
| 2. View scatter plot | 13. View histogram of OpenSNMP (*1) |
| 3. View histogram | 14. View histogram of OpenSSDP (*1) |
| 4. View radar chart | 15. View histogram of devices with open port 445 (*1) |
| 5. View bubble map | 16. View histogram of OpenDNS (from Censys data) |
| 6. View details about the histogram | 17. View histogram of total number of nodes (*1) with risks shown in 9-16 |
| 7. Change calculation date | 18. y-axis: number of ccTLDs with the same index values |
| 8. Regions cannot be set | 19. x-axis: index values |
| 9. View histogram of OpenDNS (*1) | 20. Graph title changes with each risk |
| 10. View histogram of OpenNTP (*1) | 21. View print, image download selection box |
| 11. View histogram of OpenRPC (*1) | 22. View ccTLD and y-axis value by moving the mouse cursor over graph |
*1: Data obtained from SHODAN are used.
Use this to display the print screen or download PNG, JPEG, PDF, or SVG files.
How to use the radar chart
Index scores are visualized on the radar chart. Use it to compare risks between ccTLDs.
- Main screen
- Selecting countries and regions
- Print, image download selection box
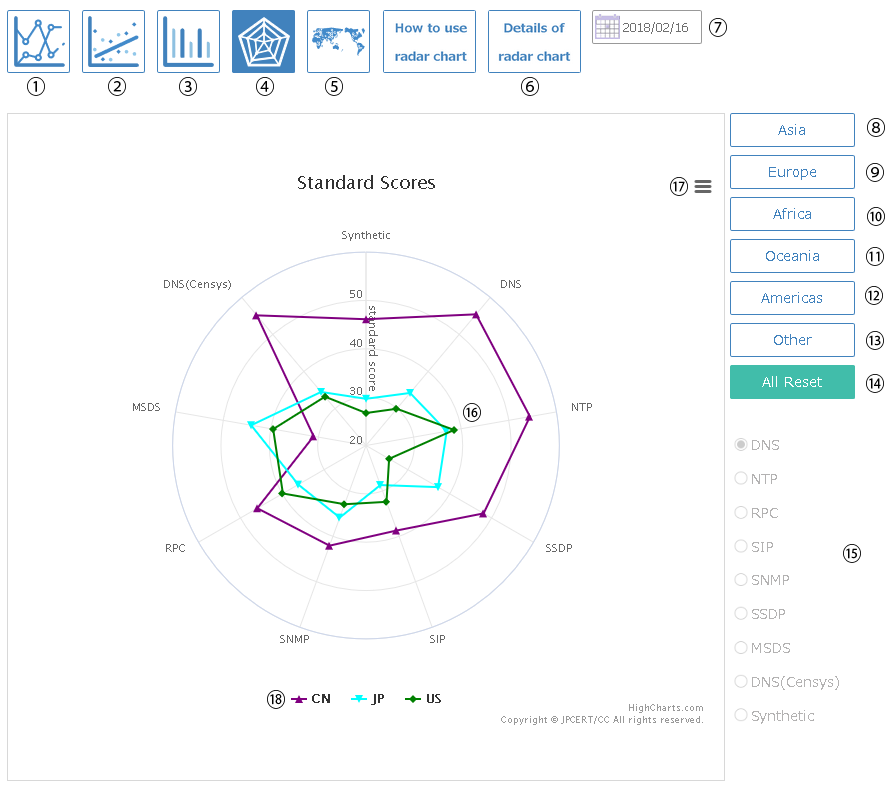
| 1. View time series graph | 10. Select a country/region in Africa (*1) |
| 2. View scatter plot | 11. Select a country/region in Oceania (*1) |
| 3. View histogram | 12. Select a country/region in the Americas (*1) |
| 4. View radar chart | 13. Select other countries or regions (*1) |
| 5. View bubble map | 14. Deselect all |
| 6. View details about the radar chart | 15. Risks cannot be selected |
| 7. Change calculation date | 16. View ccTLD and index values by moving cursor over graph |
| 8. Select a country/region in Asia (*1) | 17. View print, image download selection box |
| 9. Select a country/region in Europe (*1) | 18. Legend |
*1: Up to five countries and regions can be selected at a time.
Up to five countries and regions can be selected. Once selected, click the × mark at the top left or anywhere in the gray area outside the pop-up screen to return to the main screen.
Use this to display the print screen or download PNG, JPEG, PDF, or SVG files.
How to use the world bubble map
Index scores are visualized on the world bubble map. Use it to compare the levels of each risk by ccTLD.
- Main screen
- Print, image download selection box
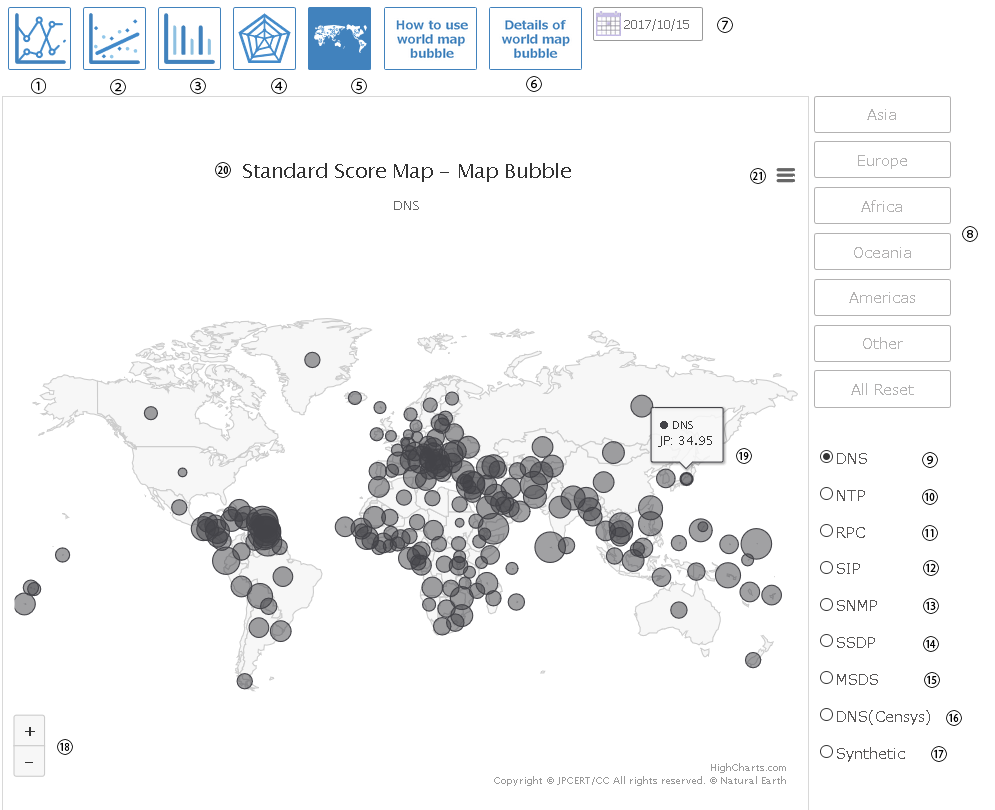
| 1. View time series graph | 12. View world bubble map of OpenSIP (*1) |
| 2. View scatter plot | 13. View world bubble map of OpenSNMP (*1) |
| 3. View histogram | 14. View world bubble map of OpenSSDP (*1) |
| 4. View radar chart | 15. View world bubble map of devices with open port 445 (*1) |
| 5. View bubble map | 16. View world bubble map of OpenDNS (from Censys data) |
| 6. View details about the bubble map | 17. View world bubble map of total number of nodes (*1) with risks shown in 9-16 |
| 7. Change calculation date | 18. Scale of map |
| 8. Regions cannot be set | 19. View index value by moving the mouse cursor over a pointer |
| 9. View world bubble map of OpenDNS (*1) | 20. Title name for each risk |
| 10. View world bubble map of OpenNTP (*1) | 21. View print, image download selection box |
| 11. View world bubble map of OpenRPC (*1) |
*1: Data obtained from SHODAN are used.
Use this to display the print screen or download PNG, JPEG, PDF, or SVG files.